LISI 2014
11
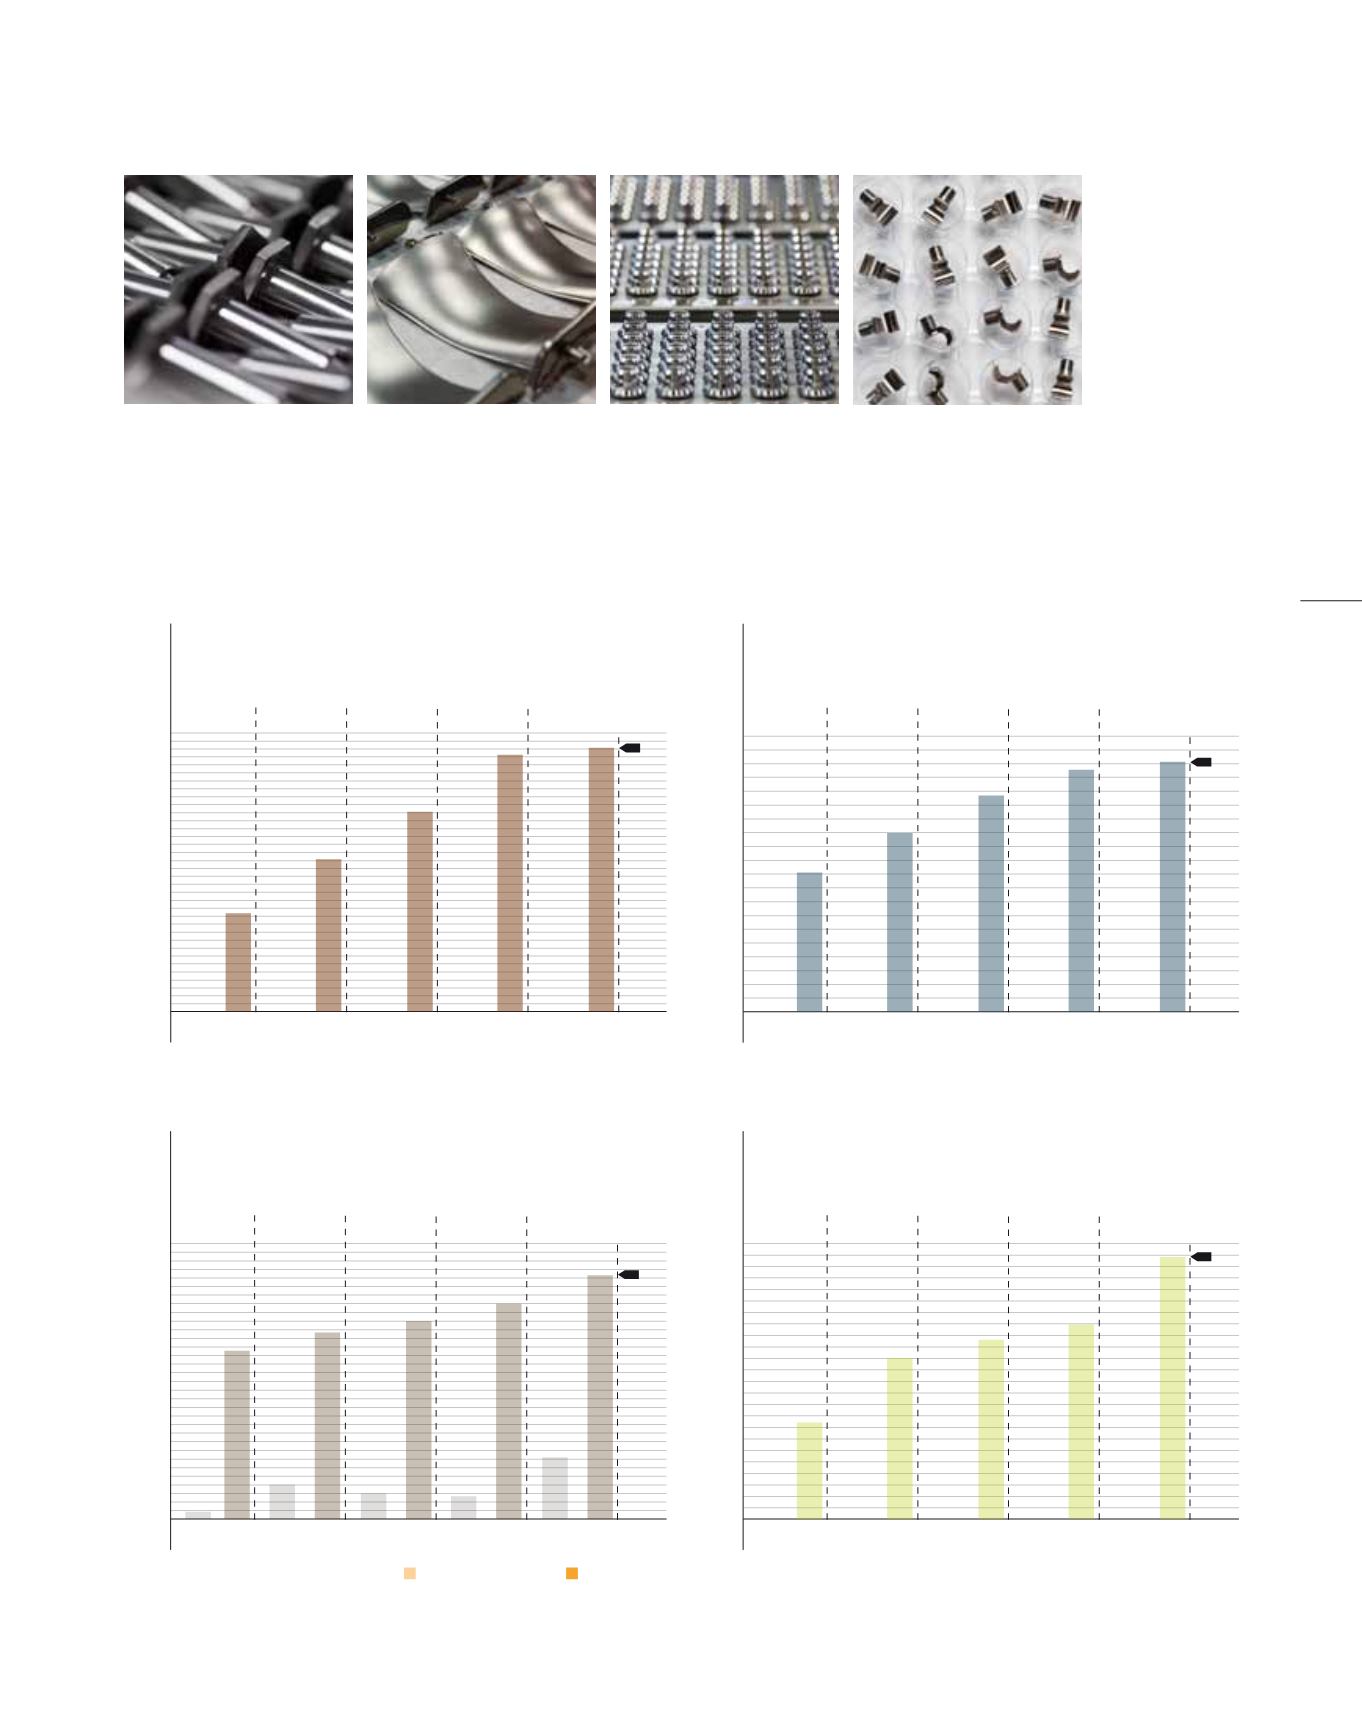
Equitycapitalandnetfinancialdebt
Workforceregistered
Netcapitalexpenditure
[ in€m ]
[ in€mand
%of sales ]
0
100
200
300
400
500
600
700
800
0
20
40
60
80
100
5,000
6,000
7,000
8,000
9,000
10,000
11,000
0
20
40
60
80
100
120
140
2010
2009
2011
2012
2013
2014
EBIT
[ in€mand
%of sales ]
49.5
6.4%
50.6
6.5%
76.6
8.3%
64.9
7.0%
100.4
9.3%
78.4
7.3%
128.9
11.2%
87.7
7.6%
€
131.7
M
10.1%
€
90.6
M
6.9%
2010
Netfinancial debt Equitycapital
2010
2010
490
18
7,101
543
102
8,512
576
77
8,909
626
68
9,239
2011
2011
2011
2012
2012
2012
2013
2013
2013
2014
2014
2014
709
M
€
181
M
€
10,701
staff


