


 78 / 87

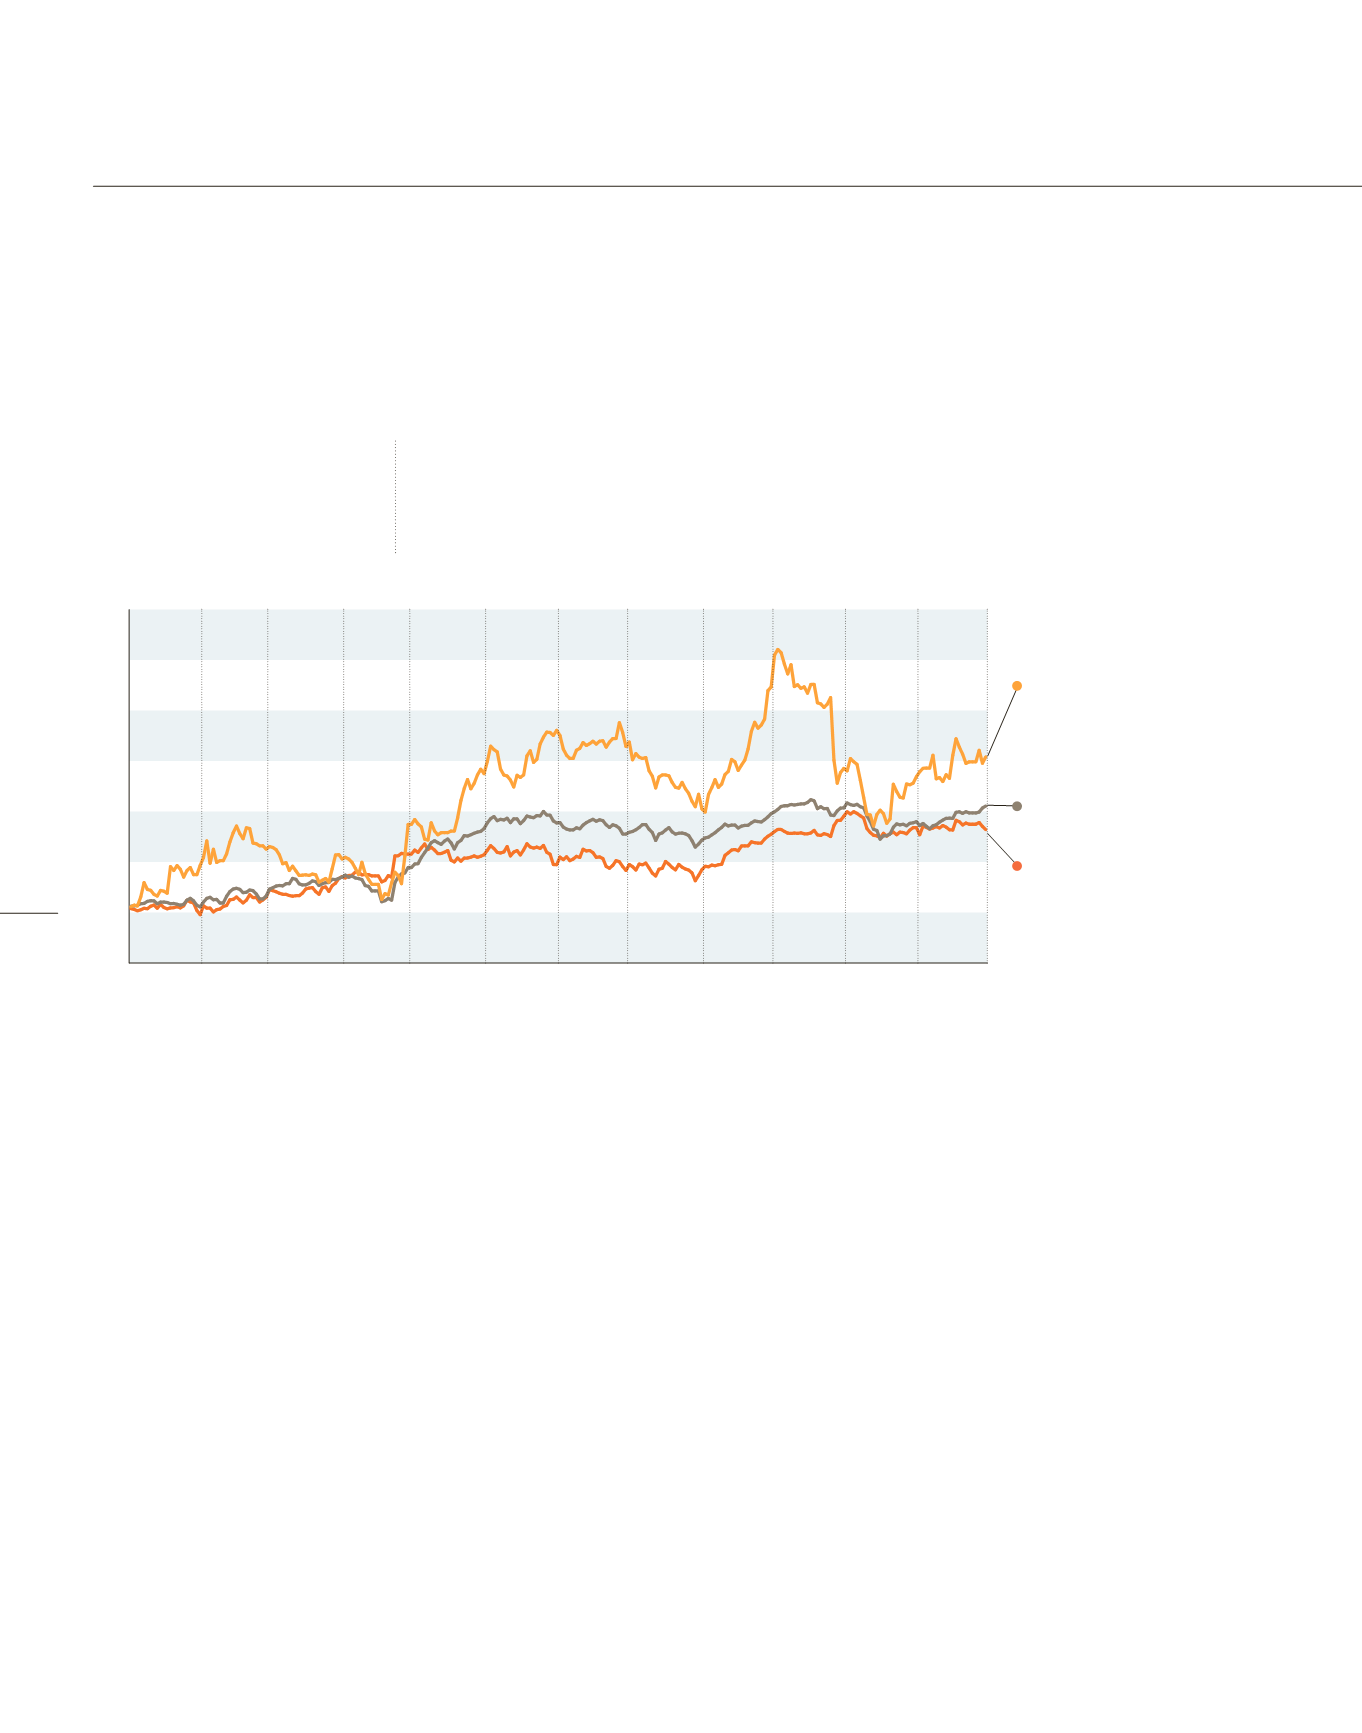
The LISI share continues its history of growth with a further increase
of more than 30% in one year. This good performance reflects good
earnings in line with expectations. This growth compares favorably
with major indices such as CAC SMALL (+21.1%) and ESTX InduGd&Ser
(+16.4%).
The end-of-year price (EUR 40.10) is close to the price range for the
year between the highest at EUR 47.60 on October 4
th
and the lowest
at EUR 30.70 on January 2
nd
.
In terms of volume, 7,418,339 shares were traded, a sharp increase
compared to 2016 and 2015, and an improvement in capital exchanged
(+234%) due to share price developments. In total over the year, 43%
of the float was traded.
Coverage of the stock
The stock is followed by 9 stockbrokers who regularly issue research
notes accompanied by opinions and objectives corresponding to the
assessment by the analyst responsible. This cover makes it possible
to obtain full and diverse information for professional or private
investors.
The LISI Group takes part in a large number of conferences, roadshows
and investor meetings for the cities of Geneva, London, Lyon,
New York, Paris, and Zurich. In total, the management of LISI met
with more than 250 investors during the 2017 financial year.
The communication policy is based on complete and transparent
communication, a presentation of the results along with the
semi-annual and annual publications and on the assessment of the
forecasts by the panel of analysts based on their macro-economic
assumptions.
+30.8%
LISI
+16.4%
ESTX InduGd&Ser
+21.1%
CAC Small Index
90
100
110
120
130
140
150
160
DEC.
NOV.
OCT.
SEPT.
AUGUST
JULY
JUNE
MAY
APRIL
MARCH
FEB.
JAN.
74
SHAREHOLDER GUIDE
+30.8%
ANOTHER YEAR
OF STRONG GROWTH
LISI’S PROGRESS OVER 2017:
EUR 40.10
PER SHARE
STOCK MARKET DATA