LISI 2012 FINANCIAL REPORT
9
1
General information regarding the company
5
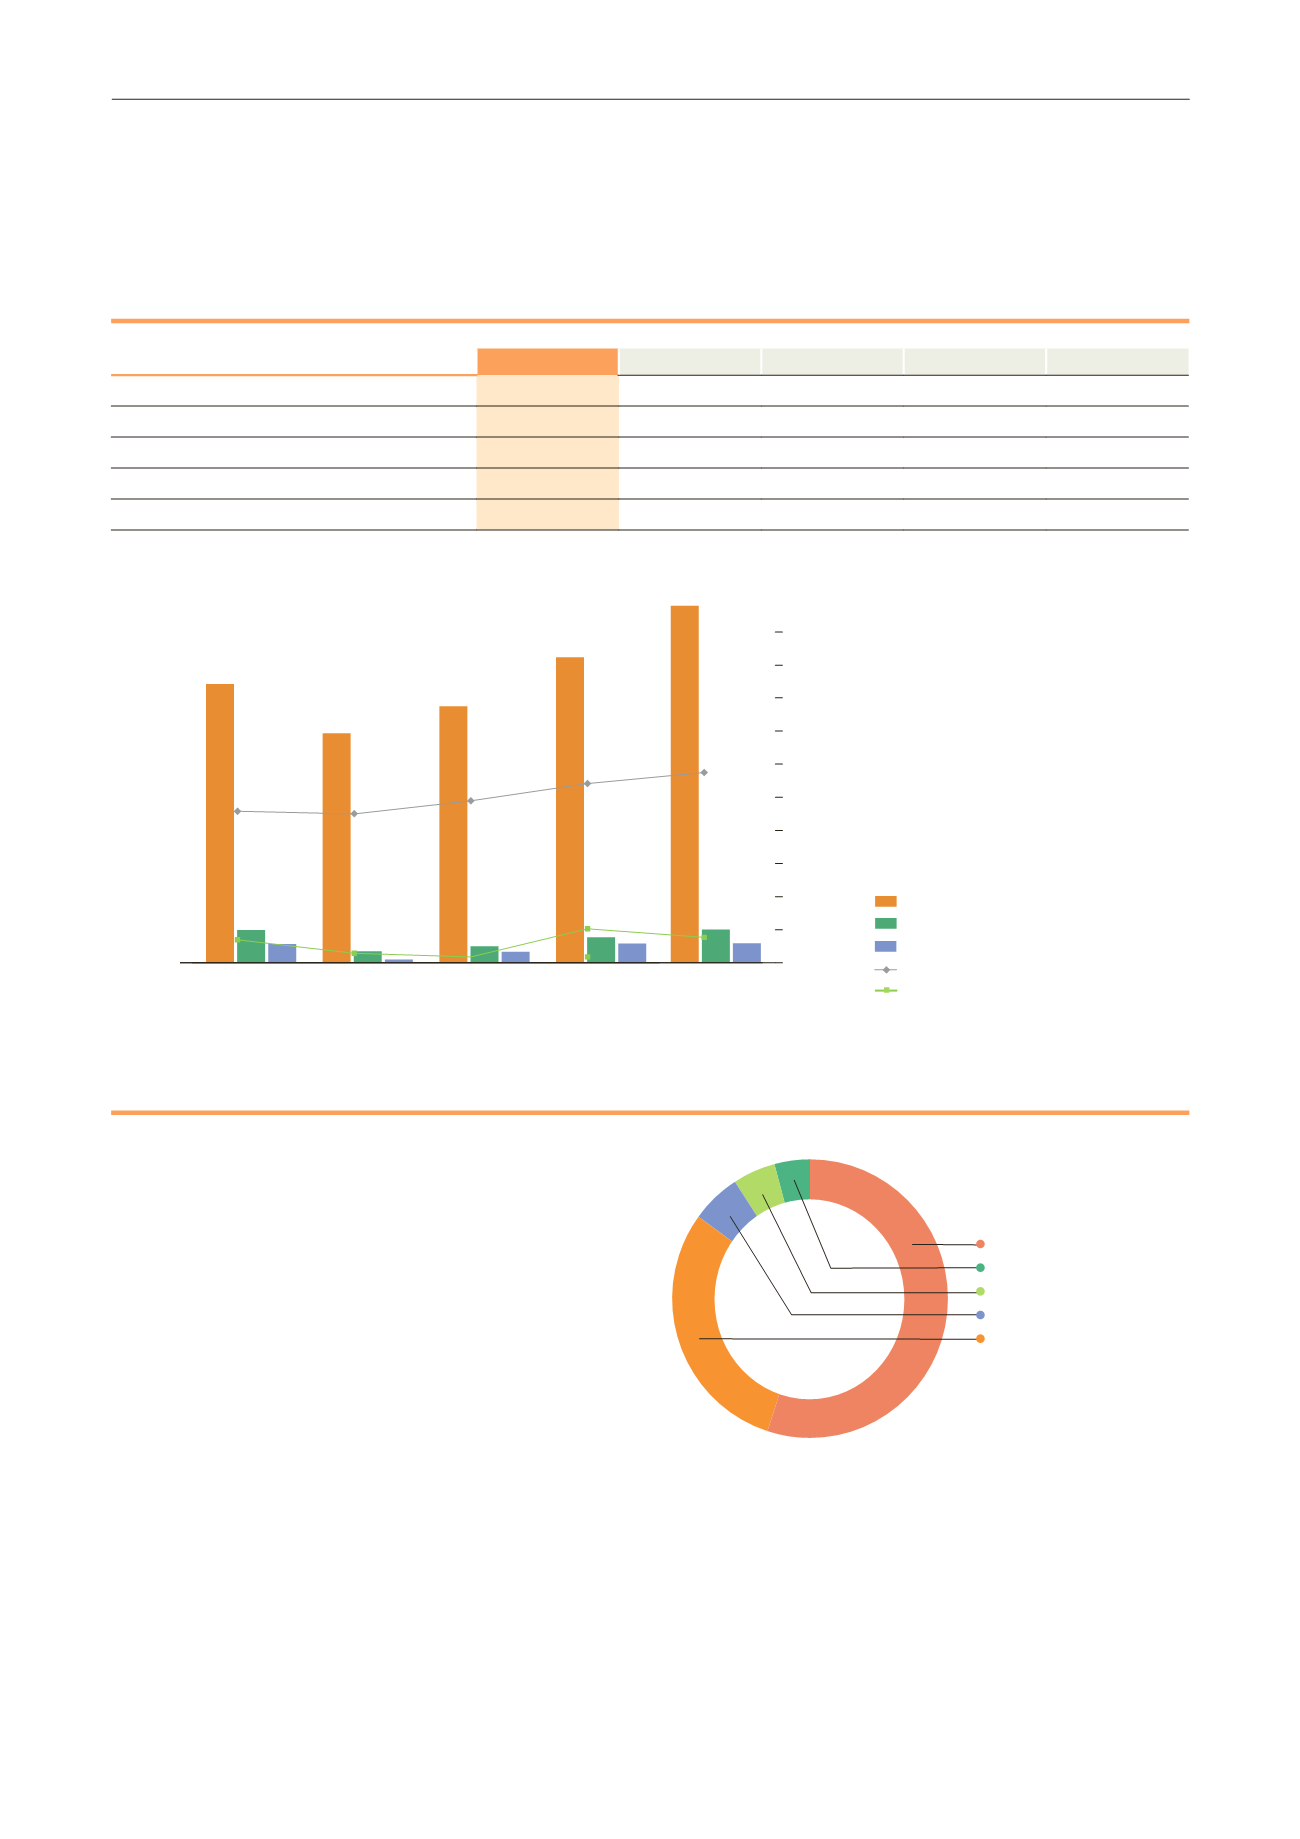
Key figures
In €m
2012
2011
2010
2009
2008
Sales revenue
1,081.3
925,1
776,7
695,1
844,3
EBIT
100.4
76.6
49.5
34.2
98.9
Profit (loss) for the period
57.3
58.2
32.9
9.4
56.2
Shareholders' and minority interests' equity
576.0
542.5
490.3
450.6
458.6
Net debt
76.7
102.6
17.5
28.5
69.4
6
Information about the issuer
6.1 Breakdown of share capital
LISI share datasheet
ISIN code: FR 0000050353
Reuters: GFII.PA
Bloomberg: FII.FP
Compartment: B Eurolist
Stock marketplace: Euronext Paris
Number of shares: 10,786,494
Market capitalization at December 31, 2012: €666m
Indices: CAC® Small, CAC® Mid & Small,
CAC®-All tradable and CAC®-All Shares
* Including direct and indirect holdings:
VMC: 21.27%
FFP Invest: 18.97%
CIKO: 16.76%
** Reserved for performance share schemes.
Sales revenue
EBIT
Earnings for the period
Net debt
Shareholders' equity andminority interests
2008
2009
2010
2011
2012
1,000
900
800
700
600
500
400
300
200
100
0
€
695.1m
€
776.7
m
€
925.1
m
€
1,081.3
m
€
844.3m
55%
CID*
2,9%
Own shares**
5,1%
FFP Invest
6%
VMC
31%
Floating stock
(including employee
savings plans for 1.4%)


