LISI 2013
11
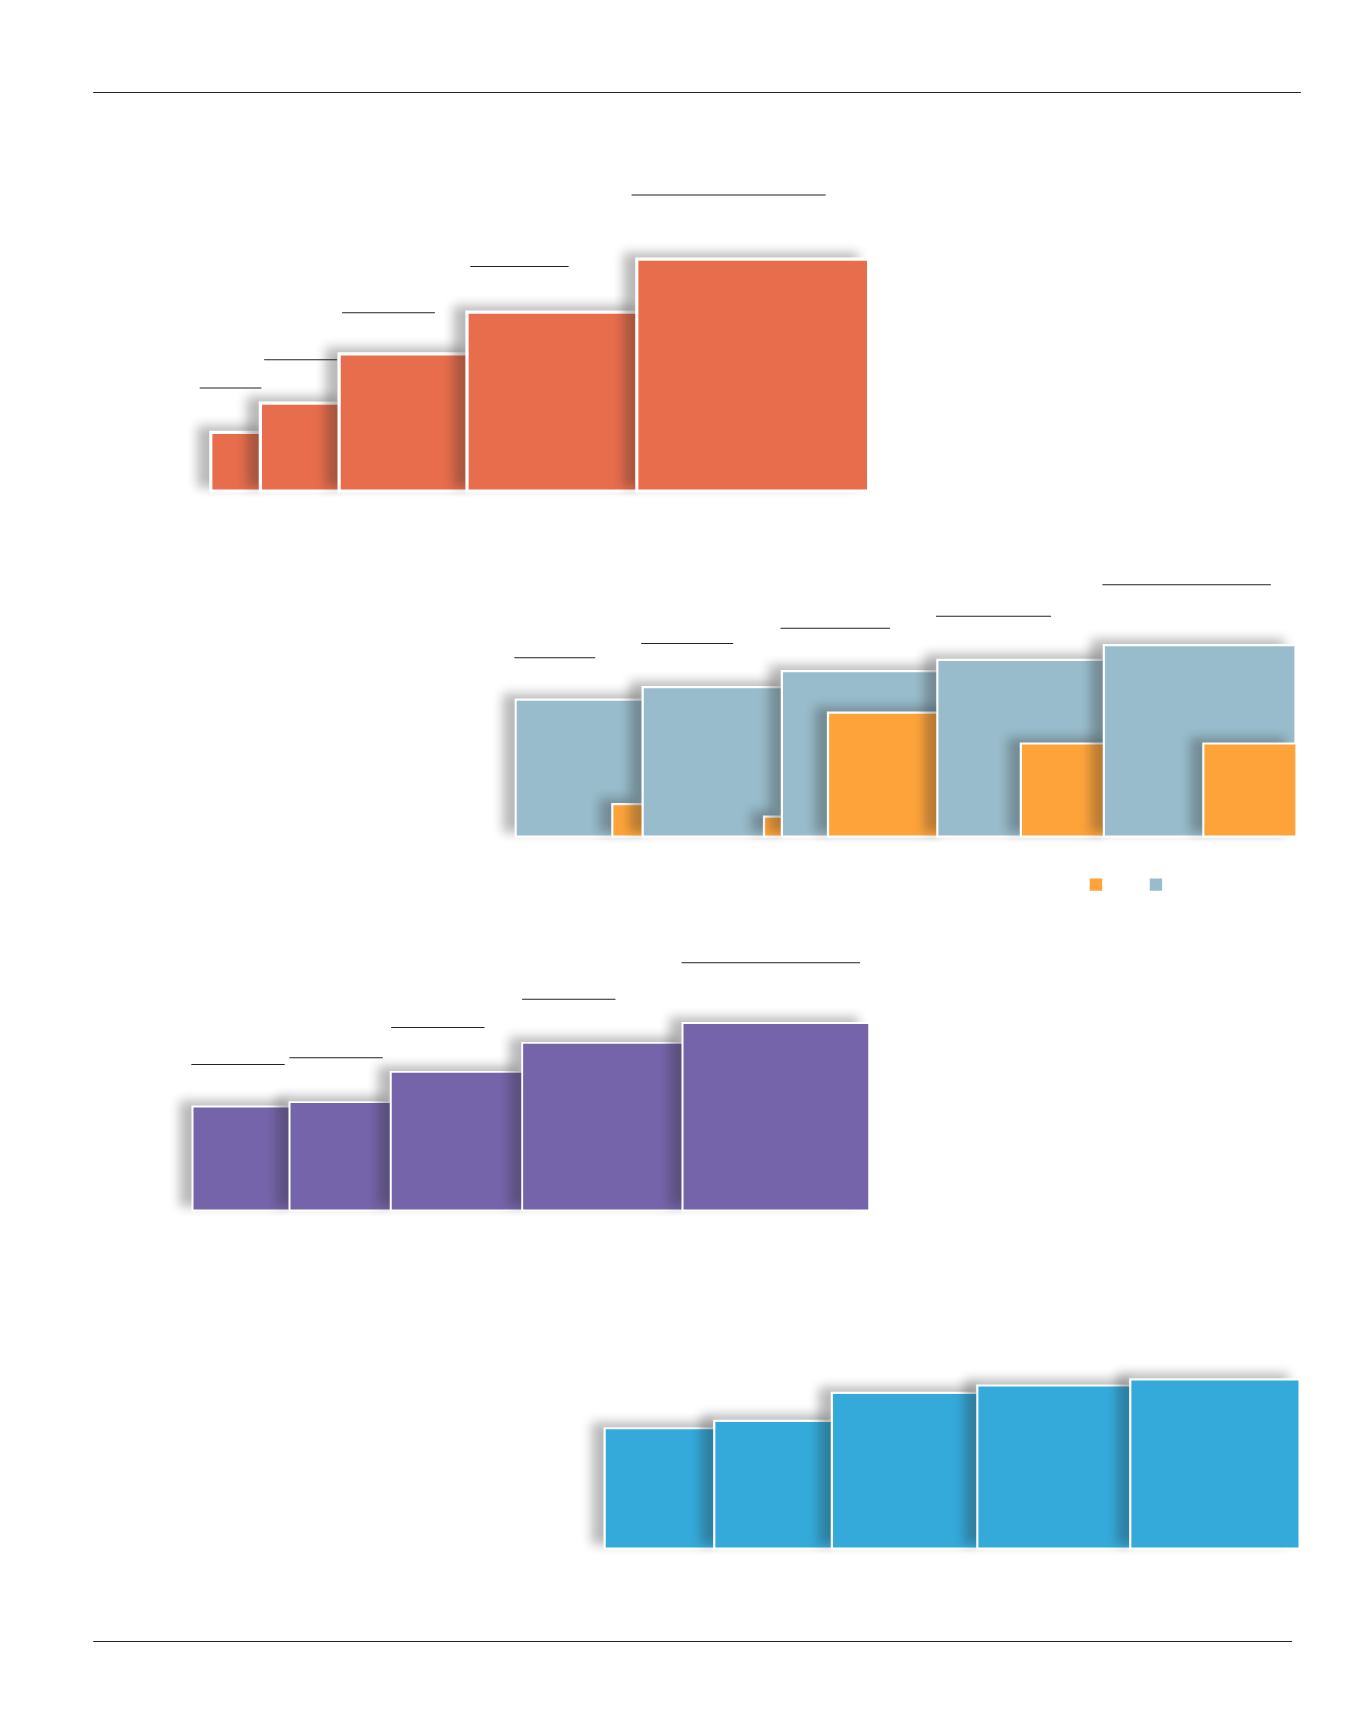
EBIT
[ enM€et en%ducA ]
2009 2010 2011
2012
2013
100,4
9,3%
128,9
M€
11,2%
49,5
6,4% 34,2
4,9%
76,6
8,3%
Investissements industrielsnets
[ enM€et en%ducA ]
2009
2010
2011
2012
2013
78,4
7,3%
87,7
M€
7,6%
50,6
6,5%
49,0
7,1%
64,9
7,0%
Effectifs inscrits
2009
2010
2011
2012
2013
8909
9239
6596 7 101
8512
2009
2010
2011
2012
2013
Capitauxpropres&endettement
[ enM€ ] EFN Capitauxpropres
576
77
626
M€
77
M€
490
18
450
28
543
102


